
Page 40 - 2022_Jour_89-1
P. 40
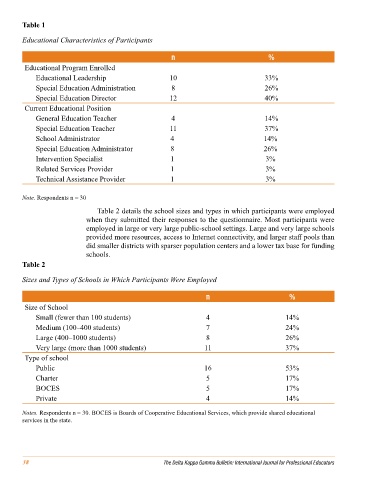
Table 1

        Educational Characteristics of Participants

                                                        n                               %

         Educational Program Enrolled
             Educational Leadership                     10                            33%
             Special Education Administration           8                             26%
             Special Education Director                 12                            40%
         Current Educational Position
             General Education Teacher                  4                             14%
             Special Education Teacher                  11                            37%
             School Administrator                       4                             14%
             Special Education Administrator            8                             26%
             Intervention Specialist                    1                              3%
             Related Services Provider                  1                              3%
             Technical Assistance Provider              1                              3%

        Note. Respondents n = 30

                                Table 2 details the school sizes and types in which participants were employed
                             when they submitted their responses to the questionnaire. Most participants were
                             employed in large or very large public-school settings. Large and very large schools
                             provided more resources, access to Internet connectivity, and larger staff pools than
                             did smaller districts with sparser population centers and a lower tax base for funding
                             schools.
        Table 2

        Sizes and Types of Schools in Which Participants Were Employed


                                                                    n                         %
         Size of School
             Small (fewer than 100 students)                        4                        14%
             Medium (100–400 students)                              7                        24%
             Large (400–1000 students)                              8                        26%
             Very large (more than 1000 students)                  11                        37%
         Type of school
             Public                                                16                        53%
             Charter                                                5                        17%
             BOCES                                                  5                        17%
             Private                                                4                        14%

        Notes. Respondents n = 30. BOCES is Boards of Cooperative Educational Services, which provide shared educational
        services in the state.


        38                                            The Delta Kappa Gamma Bulletin: International Journal for Professional Educators