
Page 42 - 2022_Jour_89-1
P. 42
Data Analysis
The quantitative data from the structured questions in Sections 1 and 2 were
analyzed using descriptive statistics. Descriptive statistics provided the number of
times and percentage of time a choice was selected.
The qualitative data from the third section of the survey were analyzed using
narrative analysis. Gilstein (2020) stated that individual experience is important in
narrative analysis. This methodology allows the unique voice of individual experience
Dr. Francie Murry to be heard—something that may not have been heard before. The five data analysis
has served as steps provided by Hsieh and Shannon (2005) guided the narrative analysis: (a) texts
an educational from the responses in Section 3 of the survey were converted into narratives; (b)
professional for more
than 40 years. She units of analysis and themes were determined; (c) rules for the coding system were
currently serves as a made; (d) the coding system was applied to all narrative data; and (e) final data
professor of special were revised, verified, and selected. The findings are presented in terms of themes
education at the identified through the broad categories of student engagement and dependence on
University of Northern home support; teacher fatigue and exhaustion; student absenteeism; and remote
Colorado in the School learning use of technology and delivery of virtual special education services.
of Special Education
in Greeley, Colorado. Connelly and Clandinin (1990) stated that researchers must be aware that the
story continues even as it is being told. Continuing the story was especially true
francie.murry@unco. for our analysis as the pandemic and the participants’ lived experiences of it were
edu ongoing.
Findings
Challenges and Triumphs: Quantitative Data
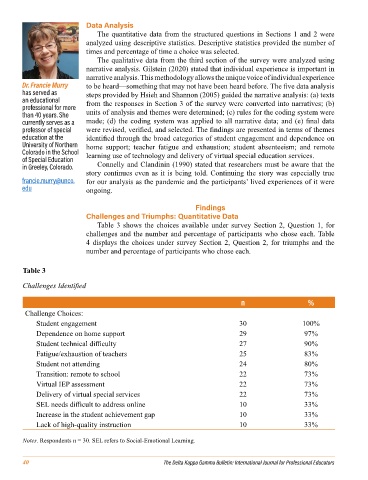
Table 3 shows the choices available under survey Section 2, Question 1, for
challenges and the number and percentage of participants who chose each. Table
4 displays the choices under survey Section 2, Question 2, for triumphs and the
number and percentage of participants who chose each.
Table 3
Challenges Identified
n %
Challenge Choices:
Student engagement 30 100%
Dependence on home support 29 97%
Student technical difficulty 27 90%
Fatigue/exhaustion of teachers 25 83%
Student not attending 24 80%
Transition: remote to school 22 73%
Virtual IEP assessment 22 73%
Delivery of virtual special services 22 73%
SEL needs difficult to address online 10 33%
Increase in the student achievement gap 10 33%
Lack of high-quality instruction 10 33%
Notes. Respondents n = 30. SEL refers to Social-Emotional Learning.
40 The Delta Kappa Gamma Bulletin: International Journal for Professional Educators