
Page 43 - 2024_Jour_90-5
P. 43
student-centered and teacher-centered practices “about half of the time,” a result that
aligns with most respondents implementing a mix of teacher- and student-centered
teaching practices. The teachers’ self-report of the frequency of implementing the
approaches aligns to the perceptions of the majority agreeing that a mix of student-
centered and teacher-centered is the most effective approach.
Teaching Strategies
Two of the survey questions focused specifically on student-centered teaching
strategies. The first question asked, “What is your perception of the following
statement? ‘I am provided adequate training and support to implement student-
centered teaching practices.’” In this case, 17.65% disagreed, 11.76% neither agreed
nor disagreed, and 70.59% agreed. The responses align to teachers’ perceptions of
T-TESS (Table 2), with 64% finding the training and support they received beneficial
for improving their skills as educators.
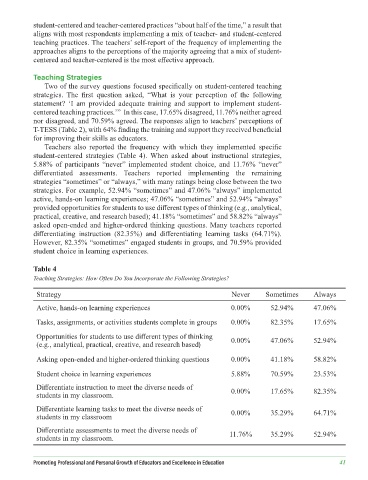
Teachers also reported the frequency with which they implemented specific
student-centered strategies (Table 4). When asked about instructional strategies,
5.88% of participants “never” implemented student choice, and 11.76% “never”
differentiated assessments. Teachers reported implementing the remaining
strategies “sometimes” or “always,” with many ratings being close between the two
strategies. For example, 52.94% “sometimes” and 47.06% “always” implemented
active, hands-on learning experiences; 47.06% “sometimes” and 52.94% “always”
provided opportunities for students to use different types of thinking (e.g., analytical,
practical, creative, and research based); 41.18% “sometimes” and 58.82% “always”
asked open-ended and higher-ordered thinking questions. Many teachers reported
differentiating instruction (82.35%) and differentiating learning tasks (64.71%).
However, 82.35% “sometimes” engaged students in groups, and 70.59% provided
student choice in learning experiences.
Table 4
Teaching Strategies: How Often Do You Incorporate the Following Strategies?
Strategy Never Sometimes Always
Active, hands-on learning experiences 0.00% 52.94% 47.06%
Tasks, assignments, or activities students complete in groups 0.00% 82.35% 17.65%
Opportunities for students to use different types of thinking 0.00% 47.06% 52.94%
(e.g., analytical, practical, creative, and research based)
Asking open-ended and higher-ordered thinking questions 0.00% 41.18% 58.82%
Student choice in learning experiences 5.88% 70.59% 23.53%
Differentiate instruction to meet the diverse needs of 0.00% 17.65% 82.35%
students in my classroom.
Differentiate learning tasks to meet the diverse needs of 0.00% 35.29% 64.71%
students in my classroom
Differentiate assessments to meet the diverse needs of
students in my classroom. 11.76% 35.29% 52.94%
Promoting Professional and Personal Growth of Educators and Excellence in Education 41